Field service metrics are the clearest way for coffee operators to understand how their service teams are performing. They reveal how efficiently technicians use their time, how quickly customer issues are resolved, and how much each job truly costs.
When tracked consistently, these numbers turn daily activity into actionable insight.
Yet, many operators only measure surface-level data, such as total tickets closed or customer complaints. While these help you identify outcomes, they don’t explain why those outcomes happen.
The real value comes from tracking metrics like first-time fix rate, technician utilization, and SLA adherence, the ones that directly influence performance, customer satisfaction, and profitability.
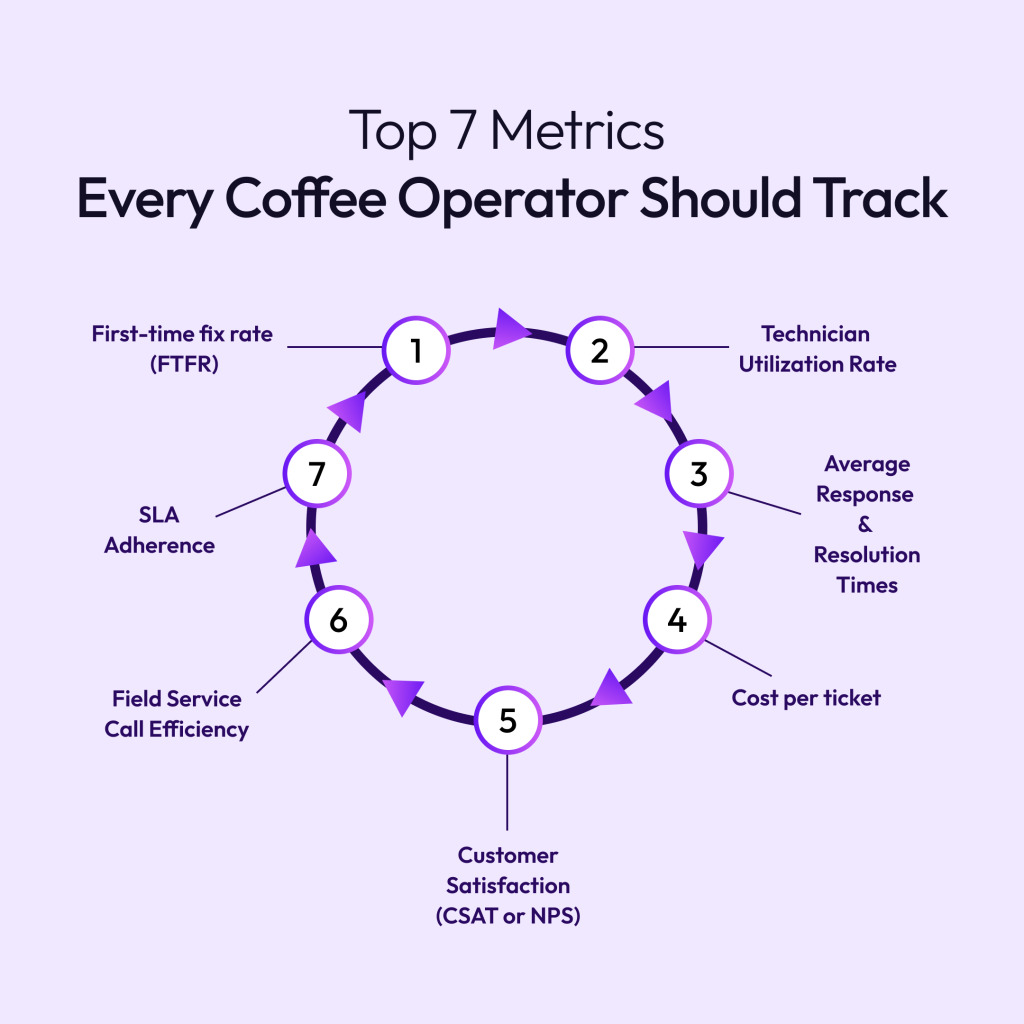
In this guide, we’ll explore 7 field service metrics that matter most for coffee operators. You’ll learn what each metric measures, how to calculate it, and how understanding these numbers can help you run a more efficient and profitable operation.
1. First-time fix rate (FTFR)
Before diving into complex metrics, let’s start with one that directly impacts customer satisfaction and cost efficiency the most: the first-time fix rate .
It’s the percentage of service tasks a technician resolves on their first visit, without needing to return with additional parts, information, or assistance.
A high FTFR means your technicians are resolving most jobs on their first visit.
A low FTFR often signals missing parts, incomplete service histories, or unclear fault reports.
For coffee operators, a missed first-time fix is more than a minor inconvenience. It means another day your customer’s machine sits idle, another trip across town for your technician, and another dent in your margins.
That’s why many teams are now relying on software for coffee operators like Dobby that help their technicians access the full job context before arrival. That clarity helps technicians prepare properly, leading to faster fixes, fewer call-backs, and happier clients.
And when first-time fix rates go up, your technician utilization rate also improves.
2. Technician utilization rate
Technician utilization rate measures how much of your technicians’ paid time is spent on value-adding work like servicing machines versus non-productive work like travelling, waiting for parts, or admin work.
Formula:
(Productive hours ÷ total available hours) × 100
This metric tells you exactly how effectively your field team’s time is being used. For example. Two technicians might both work eight-hour days, but one spends half that time driving. Without proper planning and live data, that inefficiency often goes unnoticed.
Read our detailed blog on technician utilization. to see how you can improve this field service metric and how Dobby makes it easier to keep track of how your technicians are spending their time.
3.Average response and resolution time
The next field service metrics to pay attention to are response and resolution times.
Response time is the time between when a customer first logs a ticket and when a technician reaches out.
Resolution time is the total time from request to completion of the service ticket.
Together, these metrics measure how long it takes from the moment a customer raises an issue to the time it’s fully resolved.
For coffee operators, slow response or long resolution times impact customer satisfaction, which is again a key metric you should track.
But delays in response and resolution times usually happen because of manual planning or incomplete information. When job details aren’t clear or routes aren’t optimized, the entire process slows down. Each extra hour means less efficiency and more frustration for the customer.
Dobby helps reduce these delays by automating scheduling, prioritizing high-SLA jobs, and updating technicians in real time. With accurate routing and live job data, you can keep response and resolution times consistent even as the workload grows.
Once these times are under control, the next step is to understand how much each service costs you and how it affects your margins.
4. Cost per ticket
Cost per ticket is the average expense your company incurs to resolve a single customer support or service request. It combines the financial impact of labor, travel, parts, and admin time into a single, tangible figure.
Formula:
Cost per Ticket = (Technician labor + travel + parts + admin time) / total tickets resolved.
This metric is crucial because many service operators overlook the small inefficiencies that slowly raise costs. A few extra kilometres on a route, an unnecessary return visit, or time spent on manual updates all increase the overall cost per ticket.
Tracking this metric regularly helps identify where these costs come from so you can make simple, targeted improvements.
Check out 5 ways to reduce cost per ticket . in our detailed guide.
5. Customer satisfaction (CSAT or NPS)
In coffee service, retention depends on how satisfied your customers are after every visit. Customer satisfaction, often measured through quick surveys or Net Promoter Scores, gives you a clear sense of how well your service team is performing.
However, the issue with tracking this metric is that asking customers for feedback too often can lead to survey fatigue and lower response rates. Many coffee operators also rely on manual follow-up emails that rarely get answered, leaving them with inconsistent data.
That’s where automated feedback helps.
With Dobby, you can collect feedback automatically through QR codes or post-service prompts that appear right after a job is completed. The responses flow directly into your dashboards, so you get real insights without adding extra steps for your team or the customer.
By making feedback easy and automatic, you maintain a steady view of satisfaction trends, identify recurring issues, and respond faster when customers need support.
6. Field service call efficiency
When call efficiency drops, your capacity shrinks.
Technicians who spend too much time driving between jobs or diagnosing issues on-site complete fewer tickets each week.
Over time, this affects SLA performance and overall profitability.
Using Dobby, coffee operators can shorten call durations by sequencing jobs logically, providing technicians with job details and history before arrival, and generating post-visit reports automatically. This helps the team stay productive and organized throughout the day.
Read our full guide on improving field service call efficiency to know more.
7. SLA adherence
Service Level Agreement adherence measures how reliably your team meets agreed response and resolution windows.
Formula:
SLA = (Tickets resolved within SLA window ÷ total tickets) × 100
For coffee and vending operators serving corporate offices or hospitality clients, SLA compliance is non-negotiable. Missed SLAs can mean penalties, lost contracts, and damage to your reputation.
With Dobby, you can track SLAs automatically. The system flags at-risk tickets in real time and allows you to redistribute workloads before deadlines slip. That visibility helps teams stay proactive and maintain the reliability customers depend on.
Find out more about SLA adherence and how to improve it here.
How field service performance metrics work together to boost profits
Each field service metric we’ve discussed above provides only part of the picture, but together they reveal how efficiently your entire operation runs.
When one field service metric improves, others often follow.
For instance, a higher first-time fix rate usually increases customer satisfaction and lowers the cost per ticket. Likewise, more effective routing leads to better technician utilization and stronger SLA performance.
But tracking all these metrics is challenging.
Many service teams spend hours each week compiling data for one metric, only to lose track of others. In this environment, even planning to improve performance becomes difficult because there’s no single source of truth.
At Dobby, we help you see these numbers side by side, making it easier to identify what’s working and where you might be losing time or resources. Read on to know more.
How Dobby helps improve field service management metrics
At Dobby, we help coffee and vending operators simplify their field operations and gain full visibility into performance. Our platform connects every part of your service process, from tickets and routes to technician data, so your team can plan better and act faster.
Here’s how Dobby helps:
Centralized dashboards:
See all key metrics like utilization, response times, SLAs, and costs in one view to make informed decisions quickly.
Automated workflows:
Streamline ticket creation, job routing, and invoicing to reduce manual work and eliminate errors.
Predictive scheduling:
Balance technician workloads, prevent downtime, and make sure the right person gets to the right job on time.
Coffee operators using Dobby see up to 11% improvement in their operational efficiency and 393% increase in net profits.
Check out how you too can achieve these results by improving your field service metrics. Get in touch with our team to know more.
Reduce cost per ticket of your coffee service team
Any Query? We Got You Covered!
FAQ’s
What are field service metrics and why are they important for coffee operators?
How can I measure technician productivity in my coffee service business?
How can field service metrics improve profitability?
How often should I review field service metrics?
It’s best to review field service metrics weekly for performance tracking and monthly for trend analysis. This ensures you catch inefficiencies early and make timely improvements.
What’s the difference between response time and resolution time?
Response time measures how long it takes to respond to a customer request, while resolution time measures the total time taken to fix the issue. Both are essential for maintaining SLA compliance and customer satisfaction.