
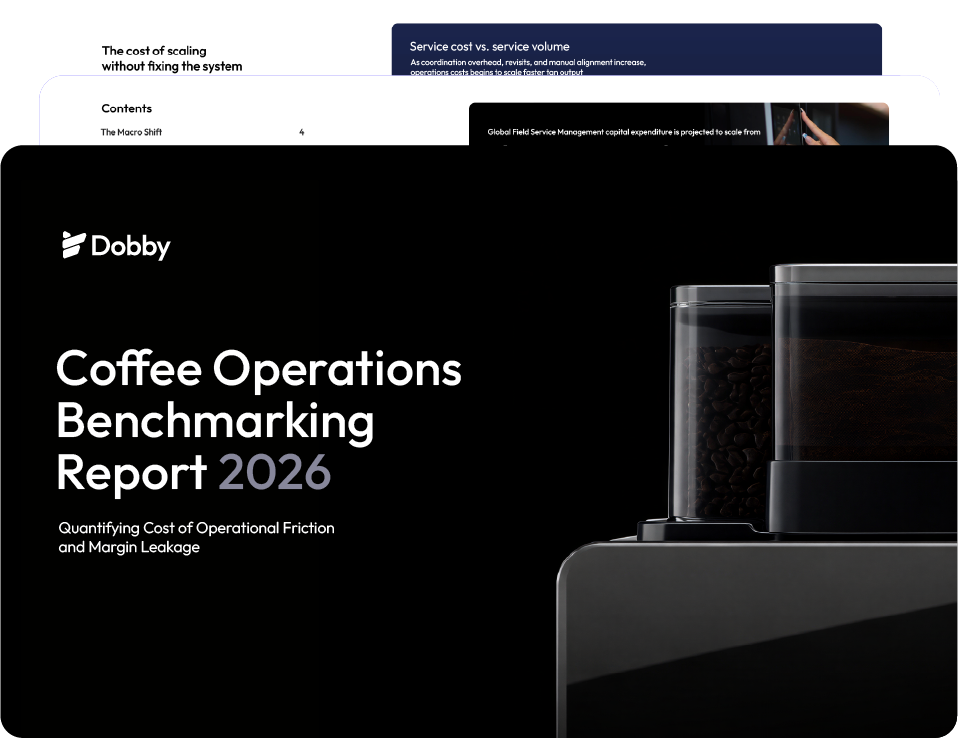
New: 2026 Coffee Benchmarking Report.

Industry insights

Insights / Defeating the 30% Coordination Tax in Enterprise Coffee Fleets

Defeating the 30% Coordination Tax in Enterprise Coffee Fleets

17 July 2026

Written By Nikolaj Gaba

Share to

About the study

Discover key findings from the 2026 Coffee Operations Benchmarking Report
a comprehensive sector analysis focused on reducing dispatch bottlenecks, eliminating repeat service visits, and unlocking hidden revenue across commercial fleets.

When expanding a commercial coffee fleet, enterprise leadership often hits a structural paradox: top-line revenue and customer demand grow rapidly, but bottom-line profitability flattens. This isn’t an execution problem—it is a system design flaw. Every new machine asset deployed introduces an exponential web of daily operational demands. When managed through fragmented, data from the 2026 Coffee Operations Benchmarking Report show that point-solution software tools (e.g., using 6–10 tools instead of an optimal stack of 3), the organization incurs a silent 20% to 30% coordination tax that rapidly erodes profit margins.

The Blueprint for High-Yield Operations

To eliminate this friction and permanently bend the cost curve down, operations must transition from isolated systems to a Unified Operating Layer. Reclaiming these leaked margins relies on moving from industry-standard baselines to optimized targets across three core variables:

Data from the 2026 Coffee Operations Report

Quantifying the Hidden Drag of Fragmentation

The friction of disconnected tools does not cause immediate, catastrophic system failure; instead, it manifests as an invisible, compounding financial drag across field service, inventory management, and back-office administration:

Technician Drive Time Inflation: As fleets scale without unified routing, dispatch becomes reactive. An extra 18 minutes of drive time per technician daily costs a typical 20-technician operation €59,400 annually in lost field capacity and fuel.
First-Time Fix Failures: Operating with a standard 25% revisit rate across 50 daily service tickets forces approximately 12.5 repeat visits per day. At an average cost of €90 per revisit (covering labor, fuel, and dispatch), this generates €237,000 in annual operational drag.
Inventory & Capital Leakage:Moving spare parts across unlinked vans and warehouses causes duplicate purchasing and waste. Even a minor 2% inventory variance on a €500K annual parts flow directly drains €10,000 per year.
Administrative Synchronization Delays: Relying on back-office staff to manually reconcile service tickets across separate systems creates an average 2-day invoicing delay. For an operation generating €400K in monthly service revenue, this stalls €26,000 in daily cash flow movement.
When field teams don’t have synchronized asset and inventory data natively unified in a mobile interface, you aren’t scaling a profitable operation—you are scaling a logistics deficit.

The Strategic Path Forward

Ultimately, employees do not choose to jump between software applications; they are forced to act as manual data bridges because their tools fail to synchronize natively. In fact, knowledge workers spend 60% of their time coordinating work—chasing status updates and validating information—rather than executing high-yield tasks.

The era of scaling via manual coordination is ending. Modern enterprise coffee operations achieve sustainable, high-yield growth by centering their entire technology stack around the asset itself—ensuring that field service actions instantly trigger warehouse inventory deductions, CRM contract updates, and automated ERP invoicing loops.

Plug the margin leakage

Uncover the Hidden Inefficiencies Draining $280+ From Every Service Dispatch
Ready to eliminate the coordination tax and scale your fleet profitably?