
Technician time is one of your biggest operational costs, and your biggest opportunity to run a leaner, more efficient service team.
Every hour your technicians spend driving between sites, waiting for approvals, or searching for missing parts is an hour not spent delivering value to customers. Over time, those lost hours add up. They show up as missed SLAs, higher fuel costs, and lower profit margins.
For most coffee operators, these inefficiencies don’t happen because of the technicians themselves, but because of how their time is managed. Understanding and improving technician utilization is the first step to fixing that.
In this blog, we’ll break down:
What technician utilization is
How to calculate it
The key factors that impact it
And five proven ways to improve it using smarter planning and automation
What is technician utilization?
Technician utilization measures how much of your technicians’ working time is spent doing productive, billable, or service-related activities, as opposed to non-productive time like travel or waiting for parts.
It is calculated by dividing the time spent on actual service work by the total available working hours and multiplying by 100.
Technician Utilization (%)=Total Available Hours / Productive Hours×100
A typical range in field service for technician utilization is between 55–70%. However, a few best-in-class operators also achieve 80%+ utilization rates.
We’ll discuss how your coffee service team can achieve this rate later in the blog, but first, let’s understand in detail how to calculate the field service technician utilization rate.
How to calculate technician utilization (with example)
Here are 3 simple steps to help you calculate the right technician utilization rate:
Step 1: Track each technician’s total available working hours per week
Step 2: Record the time spent on productive service activities like repairs, installations, and preventive maintenance
Step 3: Divide productive hours by total hours, and multiply by 100.
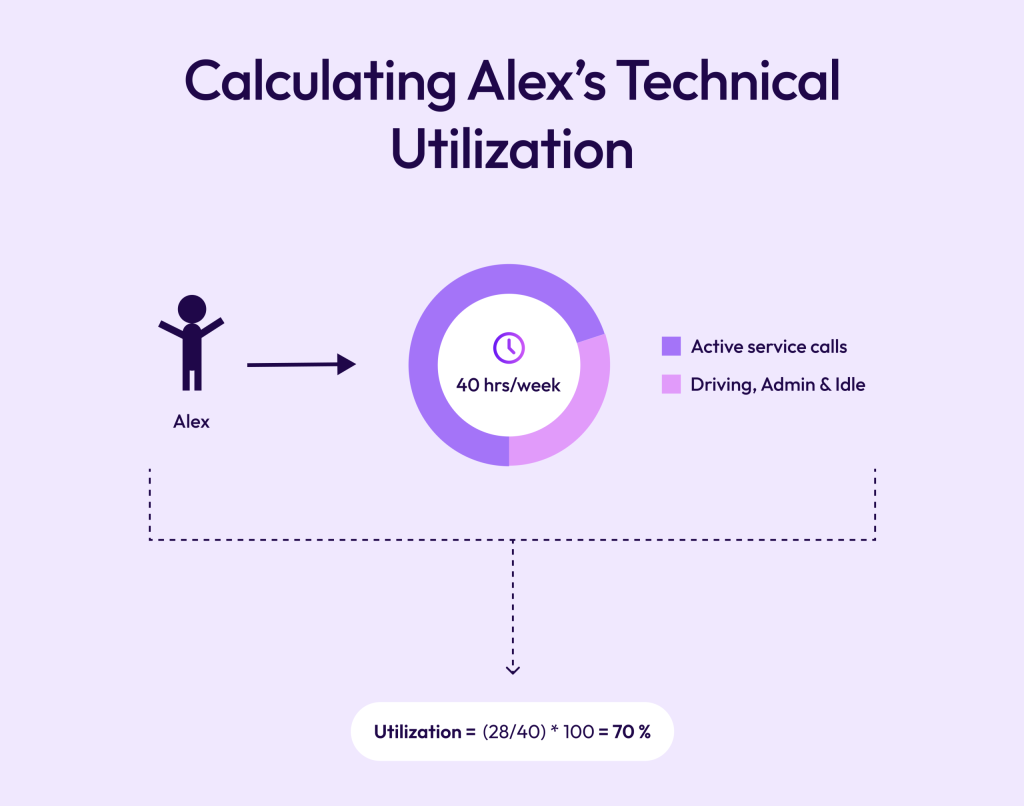
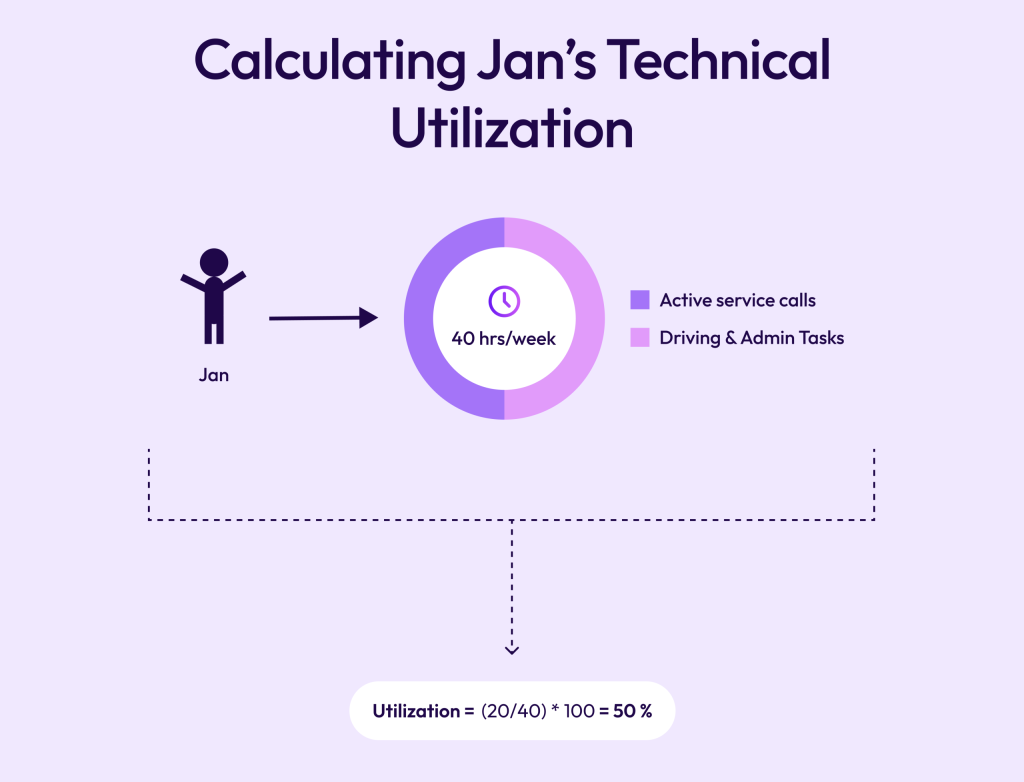
Let’s understand this through an example. Consider two members of your team: Alex and Jan,
Alex works 40 hours per week. And out of those, 28 of those hours are spent on active service calls. He spends 12 hours driving, paperwork, or idle time.
So his utilization rate is around 70%. Which is great for a field service technician.
On the other hand, Jan also works 40 hours a week. But he spends only 20 hours actually working, while the other 20 hours are spent on driving to different locations, figuring out the right parts and maintaining spreadsheets.
Identifying gaps in the technician utilization rate
A common mistake that a lot of coffee operators make while calculating technician utilization is that they rely on only one metric.
Consider this: Let’s say Alex completed 6 jobs today, while Jan completed 3.
If you just look at this one metric, you’ll conclude that Alex was more productive.
But what if Alex was able to achieve this only because he already had information about the machine history, which parts were broken, and because all his jobs were in the same area.
When you consider these factors, it’s not about who was more productive, but who had the right resources to be productive.
Before we tell you how to give your team these resources, let’s quickly take a look at why technicians end up spending so many hours on unproductive work and why it’s not their fault.
7 factors that affect technician productivity and utilization
Route planning efficiency:
Poorly optimized routes cause excessive travel and downtime. This wastes technician hours as well as fuel. Ideally, the technician should have jobs assigned in a similar location so they can complete them in one go. Here, automated route planning can recover up to 20% of wasted hours.
Job scheduling accuracy:
Continuing with the point above, you also need to consider job scheduling accuracy. The jobs should be assigned based on location, duration, and/or skill match. This way, when the technician arrives at the job, they’re fully prepared.
Parts availability:
What if Jan arrived at the 4th job, but due to the unavailability of parts and no real-time inventory tracking. , he had to return to the warehouse, and by the time he arrived back, the working hours were over? Missing parts force return visits, directly lowering productive time.
Communication gaps:
If your technicians have to wait hours for job details or approvals, their technician utilization rate would automatically reduce. Ideally, this information should be automatically updated and available to them at their fingertips.
Administrative burden:
This is often overlooked. Administrative work seems productive, but it eats up a lot of technicians' time. This can look like manual ticket logging, timesheets, searching for machine history in an archive folder, or updating spreadsheets.
Reactive vs. preventive workload:
Teams doing mostly reactive repairs experience more unpredictability. This reduces their utilization stability because they don’t plan their days; it's the machine and customer calls that dictate it. On the other hand, preventative maintenance takes back control so technicians can plan their days ahead and focus on completing the jobs at hand - rather than rushing across the city to fix a coffee machine that broke down suddenly.
System fragmentation:
This is quite similar to admin burden. Because if your data is spread across spreadsheets, multiple tools, or worse, with a single person in your organization, it's obvious that your team will experience coordination delays and duplicated effort.
How to improve technician utilization for coffee service teams?
To improve technician utilization, focus on automated route planning, balancing workload with real-time data, and giving technicians full job context. Dobby, an all-in-one platform for coffee companies that streamlines service, sales, and operations, helps with all this.
01
Automate route planning
02
Balance workloads with real-time data
03
Give technicians full job context
04
Track utilization KPIs consistently
05
Reduce idle time with predictive scheduling
1. Automate route planning
20% reduction in travel costs
10% increase in completed service calls
30% faster response times
2. Balance workloads with real-time data
When data isn’t available or when jobs are assigned manually, some technicians get overloaded while others keep waiting for assignments. As a result, Alex in your team might need to complete 6 jobs in a day, while Jan is only assigned 3. Ideally, the jobs should be distributed equally.
To do this, you can use Dobby, which provides you with dashboards that help monitor the workloads of your technicians and redistribute jobs. So service managers can view technician capacity live and reassign jobs in seconds through Dobby’s unified scheduling view.
3. Give technicians full job context
4. Track utilization KPIs consistently
Technician utilization rate also depends on other KPIs, like first-time fix rates and SLA compliance. If you’re only tracking one metric, you won’t get a complete picture of how your team is actually performing. And without accurate reporting, inefficiencies stay hidden.
Dobby helps with creating customizable dashboards that automatically calculate utilization and display trends across regions and teams. This way, service managers can focus more on analyzing and improving strategies, rather than manually keeping track of what technicians are doing.
5. Reduce idle time with predictive scheduling
When your service operation runs on reactive calls, technicians end up with unpredictable gaps in their day. Machines break, schedules shift, and you’re constantly firefighting.
Predictive scheduling changes that.
It uses past service data and machine usage insights to automatically fill low-demand periods with preventive maintenance jobs. This way, your technicians stay productive even when new tickets aren’t coming in.
With Dobby, coffee operators can connect service ticket data with usage trends from their machines. The system predicts upcoming maintenance needs and auto-generates preventive tasks, keeping every technician productive and customers happier because issues are fixed before they notice them.
Improve your technician utilization rate with Dobby
As you can see, a low technician utilization rate isn’t necessarily a people’s problem. In most cases, it happens due to poor planning and a lack of information about the job and the machine.
But when operators move from relying on manual systems to a CRM for coffee operators like Dobby, they see a remarkable increase in technicians’ productivity and overall profits.
To give you an overview, Dobby can help you achieve up to:
€4,950 per month in technician efficiency gains
€5,500 in monthly fuel savings
€30,993 in additional invoicing
An overall 15.8% return on investment
That’s possible because Dobby helps coffee operators automate scheduling and routing with real-time data. They get visibility into technician workloads and regional performance. Our platform also helps connect data across service, stock, and customer management. And finally, we also help you predict and prevent downtime through smart scheduling
The outcome is higher output per technician, faster response times, and a leaner, more scalable service operation.
Book a call with our experts to see how Dobby’s automated route planning helps service teams increase technician utilization and deliver more value per hour.